If you use Google Search Console, you may have heard of Search Console Insights, which combines data from Google Search Console and Google Analytics to give you a more complete picture of how your content is performing.
More specifically, Search Console Insights helps you answer such questions as:
Which piece(s) of my content are doing best?
How are people discovering my site?
What queries do people search on Google before visiting my web pages?
But that’s old news (well…from June, anyway).
The more recent news has to do with Google’s most recent Search Console Insights blog post, Google Search Console Insights behind the curtains. It serves as a Q&A post that seeks to address some of the questions people had about Search Console Insights.
The blog post makes the following points:
-You have to “link” or associate your site’s profile in Google Analytics with Google Search Console.
-The data in Google Analytics and Google Search Console are, of course, different. One represents data that measures on-page activity, the other represents data that measures what happened on Google search.
-Some reports are URL-based, while others are title-based, so be sure to keep that distinction in mind.
-Various metrics are calculated slightly differently, so take that into consideration.
-All pages that got their first page views within the past 28 days are considered new content, and are given the new content card, which is like a small window that shows a few key stats pertaining to new pages.
-Something else that has a 28-day range is the most popular content card. This card may show stats like page views, average time on page, and a percentage figure related to that page’s trendiness.
-The referring links from other websites card shows some of your top referring links for a particular page, as well as approximate page views and a trend percentage.
-The badges, which appear to be highlighted stats that only appear on specific cards, appear for pages that have high average duration, is one of the top 5 results on a search results page, or has a trend percentage that is higher than the average page on your site.
Empowering Content Creators With More Insights
With this data, which is an amalgamation of two data sources, a content creator can discover which of their content (identified by pages/URLs, or titles) is doing the best.
Let’s say that you have 3 pieces of content that address a certain angle on a certain topic. If those 3, on average, have better stats than most other pieces of content on your site, then there may be something to consider.
But, Playing With Data Can Be Tricky
So, all this data is great, but when looking at specific pieces of data, you have to remember that there are various factors that may explain why we see certain statistics, and we have to keep those in mind.
For example, let’s think of page A and page B. Google Search Console Insights tells us that page A has a higher average duration (high avg. duration), meaning that people spend more time on that page.
Let’s give a stat: page A has an average page view duration of 4 minutes. Page B’s is 3 minutes.
That’s fine.
But also, the content of page A is longer. Page A’s content is 33% longer than page B’s, which would mathematically explain why page A has a page view of 4 minutes, which is roughly 33% more time than page B.
So, with data, there are nuances like that that you have to keep in mind.
Another thing to consider is the stat having to do with referring links from other sites. If a given page has incoming links from other sites, it may receive traffic from those sites.
But…what if you have another page that has no such links, yet seems to be more popular among those who find it?
Data’s great, but it should be considered within context, and you need to be able to explain why you’re seeing what you’re seeing.
Finally, know that Google Search Console Insights compares pages to each other that aren’t fully equal to begin with. Each of your pages is different (different lengths, links, visibility, etc.), and those differences may skew the data you see.
Source: Google Search Central Blog
Before you can receive free updates, link building strategies or SEO tips you need to confirm your email right now.
(It’s easy)
Just go to your inbox, open the confirmation email from the SIA, and click the link.
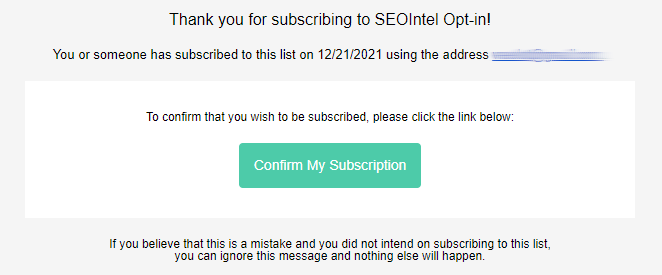
And that’s it!
PS: If you don’t see a confirmation email, please check your spam/junk or promotions folders. Sometimes the confirmation message ends up there by mistake.
Obtenez nos 7 études S.I.A. les plus controversées qui feront trembler la tête même les SEO les plus avancés d’incrédulité.
De plus, nous vous alerterons lorsque nous publierons de nouveaux tests au public.
Obtenga nuestros 7 estudios S.I.A. más controvertidos que harán que incluso el SEO más avanzado sacuda la cabeza con incredulidad.
Además, le avisaremos cuando publiquemos nuevas pruebas al público.
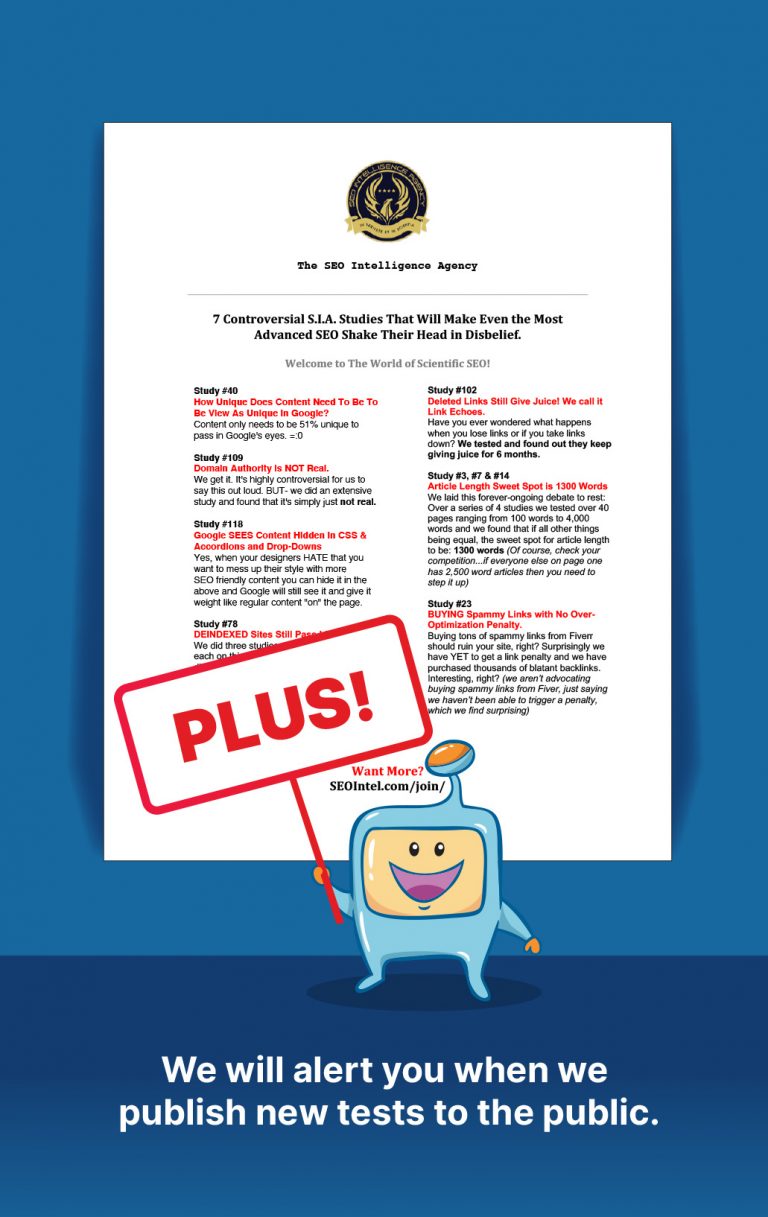
Get Our Most 7 Controversial S.I.A. Studies That Will Make Even the Most Advanced SEO Shake Their Head in Disbelief.
Plus we will alert you when we publish new tests to the public.