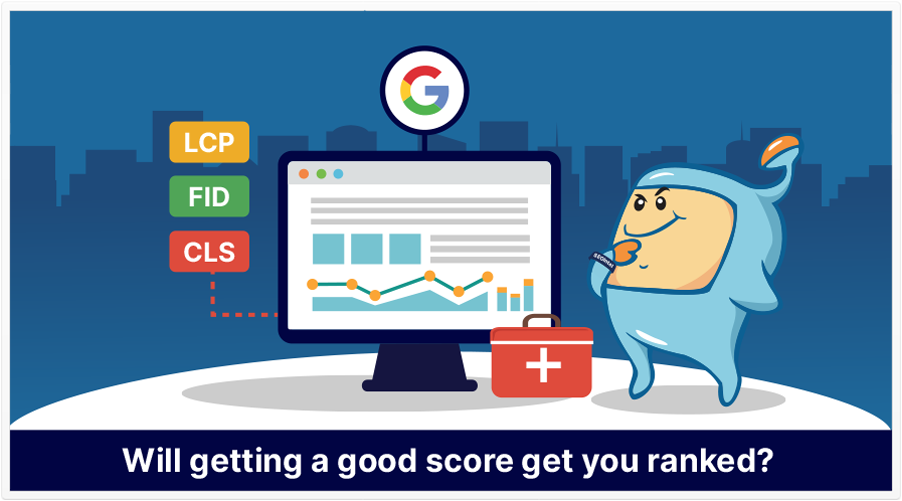
When it comes to ranking a page, Google has stated time and time again that they give importance to relevant, high-quality content. Google wants to provide a great experience to visitors of a website by providing relevant content, and a site that works well and do not have any issues once the visitor clicks on the site.
On May 2020, Google announced that they will be updating their algorithm with a page experience update. During this announcement, they have introduced the Core Web Vitals and how it will become a ranking factor, rolling out June of 2021.
But first, what is Page Experience? According to Google, page experience is a set of signals that measure how users perceive the experience of interacting with a web page beyond its pure informational value. Page Experience includes the Core Web Vitals plus Mobile-Friendliness, Safe Browsing, HTTPS Security, and compliance with Google’s Intrusive Interstitial Guidelines, which are all existing search signals.
The goal of this update was to give importance to user experience, by providing visitors of a website a more pleasant and secure page experience.
In this article, we will talk about Google’s Core Web Vitals, what they are, how to check for it, what to do to improve your score, and if they are a ranking factor.
The Core Web Vitals is a set of user metrics from Google that measures a page’s health, focusing on the aspects of content loading speed, interactivity, and visual stability. These metrics identify user experience issues and provide a perspective on different elements on a page that needs to be fixed, in order to provide a good user experience.
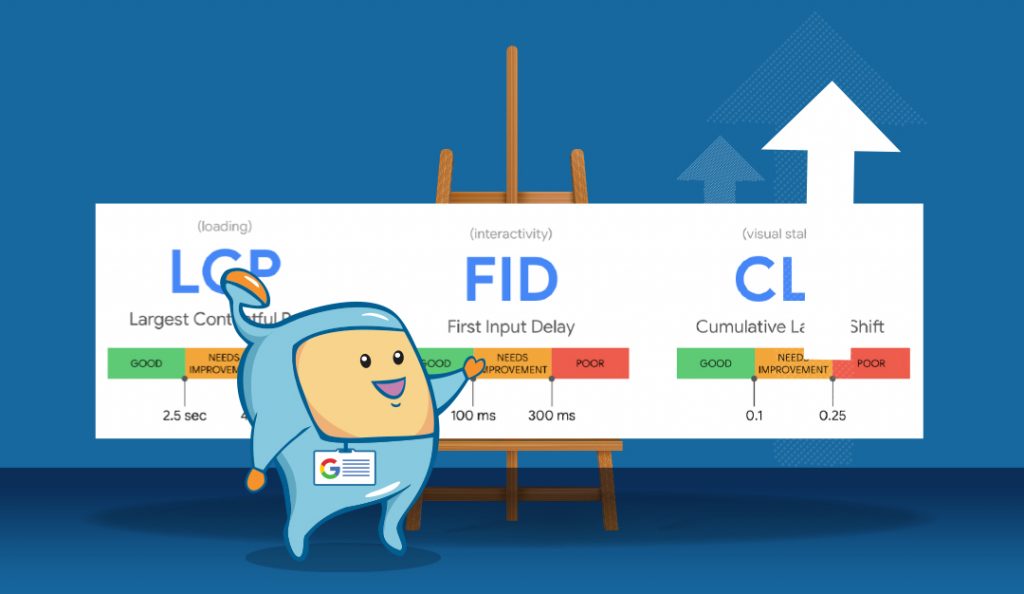
There are three main metrics when it comes to the Core Web Vitals. These are:
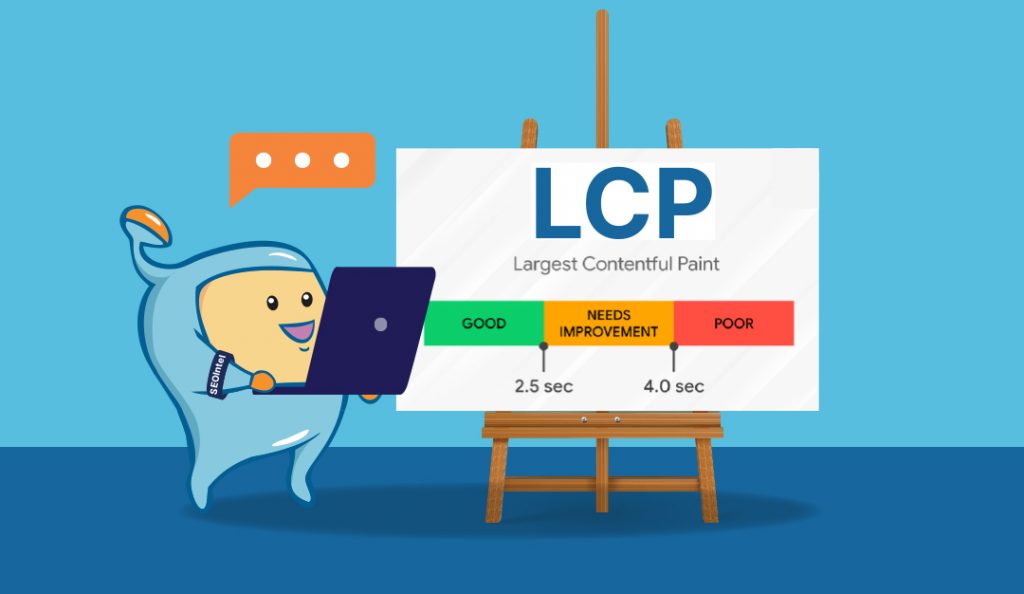
Largest Contentful Paint (LCP) measures the rendering time of the largest or main block of content visible to the visitor. This means that this is the time it takes, starting from the clicking to visit the page to seeing the majority of content on the screen. This only measures content on the visible screen and not below the fold, and it can include both media and text.
LCP is different than the other page speed measurements like First Contentful Paint (how long the site loads enough resources for a user to be able to read content on the page) and Time to First Byte (speed at which the browser receives the first byte of information from the web server and starts loading).
Largest Contentful Paint measures what really matters when a visitor gets to the page – seeing content.
Pages are scored individually and different pages can have different LCPs. Aim for an LCP below 2.5 seconds.
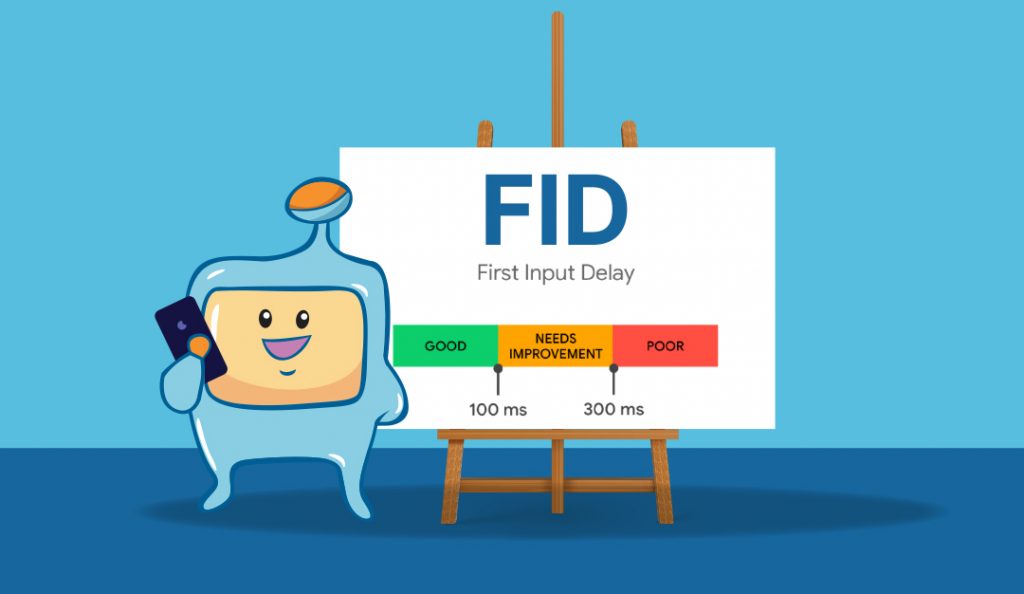
First Input Delay (FID) measures the time it takes for a user to interact with your page and do something, and for the browser to respond to that interaction (responsiveness).
Examples of user interaction with a page includes:
Clicking on the menu item or navigation
Clicking on a link
Filling up a form
Opening an accordion
Interactions like scrolling and zooming are not counted.
Aim for an FID below 100 milliseconds. Note that FID is only available in field data as it requires an interaction from a user. For lab testing, the Total Blocking Time metric is used because it closely correlates with FID.
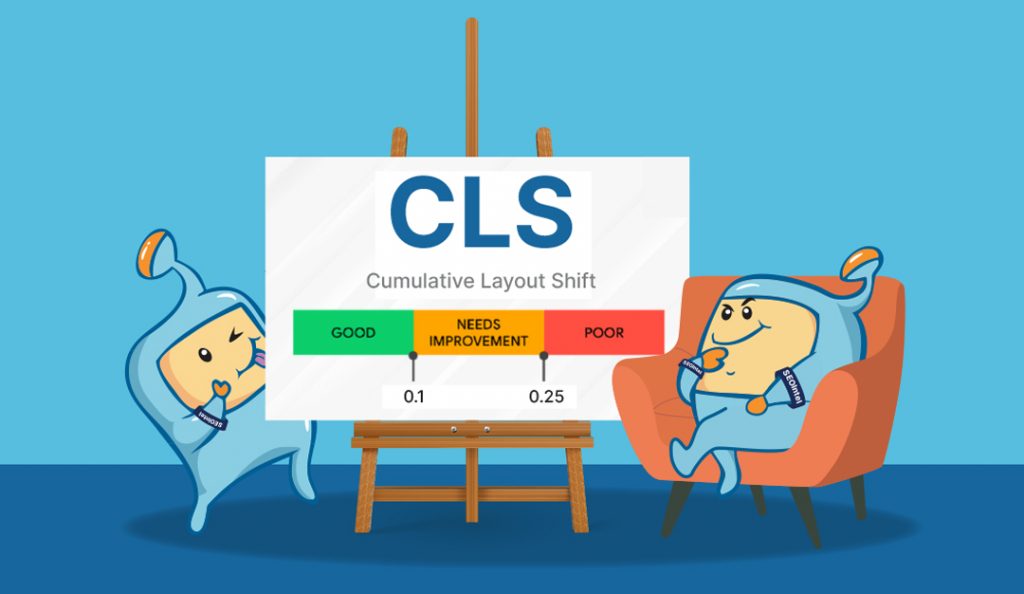
Cumulative Layout Shift (CLS) is the visual stability of the page while it is loading. This means that a page that has elements moving around while loading, will have a high CLS. The elements on a page should be stable as it loads up the content. By being stable and not shifting positions, users would be able to know where particular links, images, etc. are located once the page fully loads.
CLS shows the level of difficulty that users may experience when engaging with the elements on a page once it renders. Shifting positions of links, images, and texts, may confuse and frustrate users, causing bad page experience.
Unlike the two other metrics, CLS is not measured in seconds. CLS is a score that relies on factors such as the layout shift, impact fraction, and distance fraction, when determining the visual stability of a page.
Aim for a CLS of 0.1 or less.
Those are three of the main Core Web Vitals that Google Considers in their Page Experience Algorithm.
There are also other non-core web vitals to look into, if you would like to understand more and improve on how users experience and interact with your page. These factors are:
First Contentful Paint (FCP) measures the time from when a page starts loading to when content on a page is rendered. It can be text, image, non-white elements, and SVGs.
Having a fast FCP reassures visitors that the page is loading. An FCP of 0 – 1.8 seconds is considered good, 1.8 – 3 seconds needs improvement, and 3 seconds and above is poor.
Total Blocking Time (TBT) measures the total time between the First Contentful Paint and the Time to Interactive where the main thread was blocked for long enough to prevent input responsiveness. The main thread is blocked any time there is a task that runs on the main thread for more than 50ms. The main thread is “blocked” because the browser can’t interrupt a task that is in progress. In case the user interacts with the page in the middle of a long task, the browser must wait for the task to finish before it can respond.
TBT is calculated by taking the sum of the blocking portion of all long tasks. A TBT of 0-200ms is good, 200-600ms needs improvement, and more than 600ms is poor.
Speed Index (SI) measures the average time that content on your site takes to display to a user. The measurement is calculated by using a frame by frame analysis of the page load behavior, counting the visual progression captured between frames every 100ms. The metric identifies excessive JavaScript on a page. A speed of 0 – 3.4 seconds is considered good, 3.4 – 5.8s needs improvement, while over 5.8 seconds is poor.
Time to interactive measures the time it takes for content on the page to become fully functional and interactive. For the page to be interactive, it needs to display useful content, have most of the visible page elements rendered, and for it to be able to respond to user interactions within 50ms.
TTI helps identify pages with unnecessary JavaScript and is measured in seconds. A TTI score of 0-3.8 seconds is good, 3.8 – 7.3s needs improvement, and 7.3 seconds and above is poor.
The Page Performance Score is a single metric that takes into consideration all the important user metrics in the Core Web Vitals. It is an aggregate score across mobile and desktop visits that takes the weighted average, in order to provide a single score to understand pages that needs to be closely examined. A score of 90 and above is considered good, 50-90 needs improvement, and below 50 is poor.
Those are just some of the non-core Web Vital metrics that can help you take a closer look at your site/pages and its performance.
Basically, largest contentful paint, first input delay, and cumulative layout shift are the three major metrics that Google looks into when it comes to the Core Web Vitals, and in turn, Page Experience.
Aside from Google stating that the Core Web Vitals are a part of the Page Experience Update and that it will be a ranking signal, visitors prefer fast loading and easy to use sites, on any device.
Aside from getting yourself ranked in search, providing a great user experience should also be a priority. If your site loads more than 3 seconds, visitors would end up bouncing and leaving your site, which translates into a lost conversion or lost sale.
Providing great user experience is a win-win situation, in terms of winning search and winning visitors/clients/customers.
Before we proceed with how to check the core web vitals for your pages, it is important to discuss the two sources that Google uses to gather the data for it. The two sources are the Field Data and Lab Data.
The Field Data or Real User Metrics (RUM) is collected from users over the course of a month, based on what they experience when viewing your site. It is part of the Chrome User Experience report (CrUX). It is real data from Chrome users that opted to sharing their stats.
Lab Data, on the other hand, are generated on demand with testing tools on your browser or server, using settings that try to approximate what users would see. This data is gathered in a controlled environment without involvement from real users.
According to Google, for search rankings, field data is used as this is what users have experienced over time and this makes the data more representative of your site, taking into account where the users are located and how they access your site. The data is also divided by mobile and desktop, and applied appropriately for search.
Initially, the page experience ranking signal applies only for mobile search. Nevertheless, it is still best to also take into account the data for your desktop version as this could eventually roll out in Desktop search.
Now that we have that covered, let us proceed with how to check your Core Web Vitals.
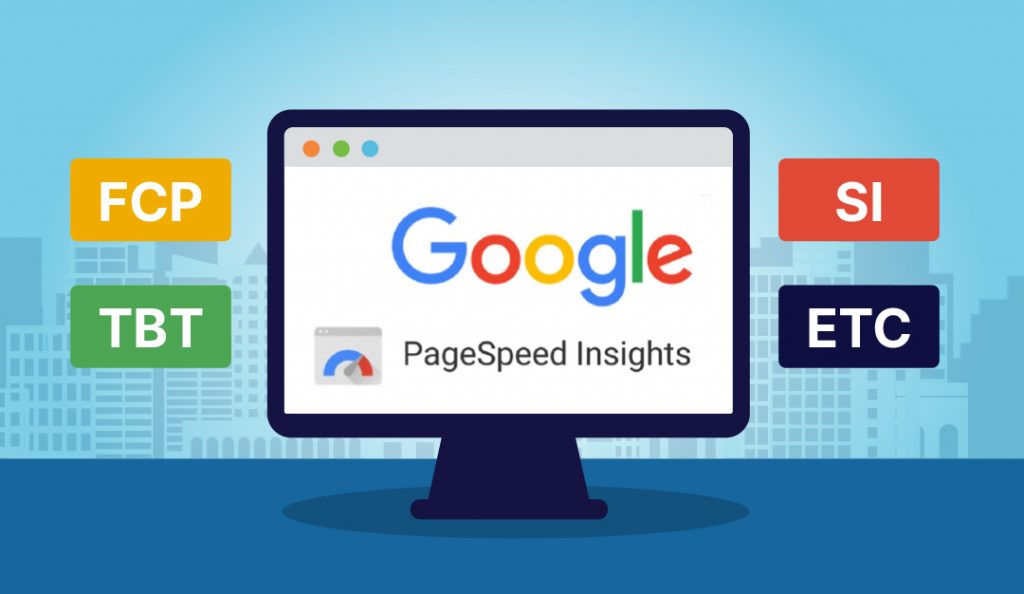
Google has two main areas where you can check your Core Web Vitals – in PageSpeed Insights and in Search Console.
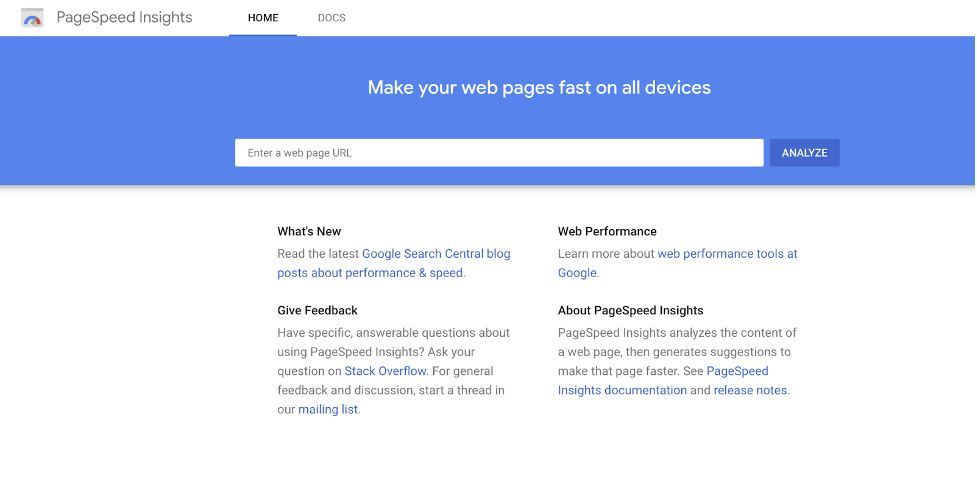
PageSpeed Insights includes a Core Web Vitals Field Data provided by the Chrome User Experience Report (CrUX). The data shown is from real users gathered over a 28-day period.
Aside from the Field Data from CrUX, PageSpeed Insights also show Lab data, Opportunities or suggestion that you can do to help your page load faster, and Diagnostics that provide more information about different elements that can be affecting your metrics.
PageSpeed Insights also provides a calculated overall optimization score, however, this score is based on lab data. The scoring is 0-49 is poor, 50-89 needs improvement, and 90-100 is good.
There are also some instances when PageSpeed Insight might not provide field data when CrUX has not been able to collect enough field data, more commonly for smaller websites.
Search Console also includes a Core Web Vitals Report which is divided into two – one for Mobile and another for Desktop. The reports provide field data from CrUX for your pages and their performance.
The reports are great because the urls are sorted according to what issue is seen on the page. This helps you get information for your entire site, instead of just one page at a time.
It is also helpful in finding common issues across different pages. Note though that these information are based on field data, so not all urls are reflected, only those that are commonly visited by users of your site.
After fixing these issues, you can also alert Google that you have fixed the issue by clicking on “Validate fix”. Take note that any changes you make on your site will take a month to validate and reflect on the reports.
The Core Web Vitals Report in Search Console is your best way to track Core Web Vitals issues for your site.

So you’ve tested your pages and found that you have failed in the assessment for some Core Web Vitals Metrics? Here are some Core Web Vitals Issues, some potential reasons for the issue, and how to fix them.
Reaching an LCP of less than 2.5 seconds can be difficult for large pages that have lots of features such as high-resolution images and other media. This may mean you would need to remove some unnecessary images on the page and/or optimize your images, and clean up your code. With regards to image optimization, we have an article on using WebP and AVIF that you might be interested in.
Other causes for a high LCP are slow server response time, some render-blocking CSS and Javascript, among others. PageSpeed insight reports should be able to give you more details on what exactly is causing the slow down.
Here are some other things to do to help improve your LCP:
o Remove third-party script and plugins that are not necessary.
o Upgrade your hosting.
o Consider using a CDN.
o Set up lazy loading on your pages so that the images will only load when users scroll down the page where the image is.
o Remove large page elements or optimize them.
o Optimize and Minify by removing unnecessary characters in your code. Try to reduce the number of JavaScript and CSS files, group them together, if possible.
o Preload hero images as these are usually the most meaningful above the fold element.
After FCP, the next metric measured is the First Input Delay and the question for this is, are the users able to interact with your page? This score and the interaction on the page actually depends on what type of content you have. For blog pages, the score is not all too important as the users are only going to scroll and read through the page. There is no actual interaction like clicking on a menu or link, or filling up a form, which is what triggers the interaction.
However, for pages that does have an interaction, FID is a big deal. It matters how quickly a user can click on a part of the page or how fast they can start filling up a form, or how fast they can log in.
A common issue for a low FID score is when a browser’s main thread is busy parsing and executing JavaScript code. A busy main thread cannot respond to an interaction.
If you have a low score in FID, here are some things to do to improve it:
o Minimizing or deferring your JavaScript.
o Minify and compress CSS files.
o Remove unnecessary third-party scripts, trackings tags, and plugins.
o Use Web Workers – this allows you to run scripts in the background without affecting the main thread.
o Leverage your browser cache information so that browsers remember visitors that come back to your site and is able reload the page faster. This, however, is mainly for repeat visitors and does not apply to new users.
Design and UX is important factors to a good user experience and shifting elements can confuse and frustrate visitors.
Shifts in layout and elements happen when images, videos, ads, or other media do not have a defined dimension, when resources are loaded asynchronously, and when new elements are added dynamically to a page, shifting content that has already been loaded.
Here are some things to do to improve CLS:
o Use a set attribute dimension for videos, images, and other media so that the browser knows how much space each element takes up on a page and would not adjust as the page loads.
o Have a reserved or specific space for ads and avoid inserting ads and pop-ups above other content.
o Add UI elements below the fold so that they don’t push down content and things stay where they should be.
o Optimize font delivery.
A common cause for a low FCP score is a high server response time and some render blocking resources. Eliminating render-blocking resources, removing unused CSS, minifying, and using a CDN can fix FCP issues.
The most common cause for a low TBT is unnecessary loading, parsing, or execution of JavaScript. It could be that the main thread is doing unnecessary work to load a page.
Another is inefficient JavaScript statements. Reducing JavaScript payloads with code splitting, removing unused code, efficiently loading third-party JavaScript, and refactoring your code can help improve your TBT score.
Anything that prevents the page from loading fast can lower your SI score such as the main thread being blocked, and the other causes mentioned in the other metrics. Improving the overall performance of the page will also improve the Speed Index score.
Same as with the Speed Index issues mentioned, issues caused in the other metrics also increases the TTI score since it is a metric that encompasses those other metrics. Improving the overall performance of the page should also, in turn, improve the TTI score.
Those are the common issues that may be giving you a low score in your Core Web Vitals assessment and some fixes to help you solve them.
Going through the reports in PageSpeed Insight and the Core Web Vitals report in Search Console can help you determine the issues and also provide fixes that you can do to help improve your score.
Something that you may have also noticed is that, the fixes for the issues also solve issues encountered in the other metrics. Making one improvement is bound to provide improvements in all the other metrics, also.
It all really comes down to removing unnecessary third-party tools, scripts, elements, CSS, and JavaScript. I would call it – simplifying.
In the May 2020 announcement by Google, they have said that the Core Web Vitals will become a ranking signal. The roll out began in June 2021 and was completed on September 2021. Google has given enough time for site owners and web developers to make changes and fixes to their site to prepare for the update, with the expectation that it is a ranking factor and not having bad metrics would drop a site, while a site with good metrics will experience a boost in rank.
The question remains though, is core web vitals a ranking factor? Will having a high score provide you a ranking boost?
According to Google, they prioritize pages with the best information, even if some aspects of the page experience is sub-par. A good page experience does not override great, relevant content. This means that quality content is still the main factor in ranking a page and that the core web vitals while stated as a ranking signal, does not override quality content. They say that if you are trying to rank for a niche where information quality is identical across sites, then the core web vitals can make a difference.
Something else that John Mueller has stated is that the Core Web Vitals is more than a random ranking factor. It also affects the site’s usability when people actually visit the site. According to him –
“If you get more traffic and your conversion rate is low, that traffic is not going to be as useful as when you have a higher conversion rate (assuming UX/speed affects your conversion rate, which it usually does).”
In a Google AMA session, he has also answered that making improvements from a needs improvement score to good, you would be able to see improvements to your rank. However, once you reach the good threshold, you are at a stable point and micro-optimizing things to a milli-second is not going to do your site any ranking improvement. It might have an effect on what users see and you might see some positive effects, but when it comes to search, you will not see any ranking improvement if you are 5 milliseconds faster than your competitors.
Despite this, there are a lot of SEO Professionals and SEO Agencies that provide Core Web Vitals services and are charging to improve a site’s score, with the selling point that it is a ranking factor that would help boost a page up.
This is what led our Lead SEO in the SIA, Clint Butler, to do a test on the Core Web Vitals to see if the various elements under the Core Web Vitals were indeed a ranking factor.
This particular test is a 45-page test that did not only focus on testing the 3 main Core Web Vitals, but also over 20 factors that were measured in PageSpeed Insights. Define comprehensive and complete!
The question is, are the Core Web Vitals a ranking factor? Which element is a ranking factor and which ones aren’t? What did Clint discover? Check out Clint’s comprehensive test on this on SEOIntel.com
Though the page experience update has been completed in September 2021, note that this update was only rolled out for Mobile Search and may also be rolled out in Desktop Search in the near future. Google is also still testing and is continuously improving on the core web vitals metrics. They have also revealed the plans for reworking FID and creating a better and more responsive metric.
Whether it is a ranking factor or not, making improvement to your Core Web Vitals and Page Speed should be an important part of building and maintaining your website. Providing visitors of your site with a great site that loads fast, is accessible and easy to use should be a priority.
It may not exactly get you to the top, it could help, but at the end of the day, we build or site and pages for the users. Satisfied users translate into conversions. Conversions lead to a happy site owner/business owner.
In the game of Page Experience and Core Web Vitals, making improvements is a win-win situation.
Before you can receive free updates, link building strategies or SEO tips you need to confirm your email right now.
(It’s easy)
Just go to your inbox, open the confirmation email from the SIA, and click the link.
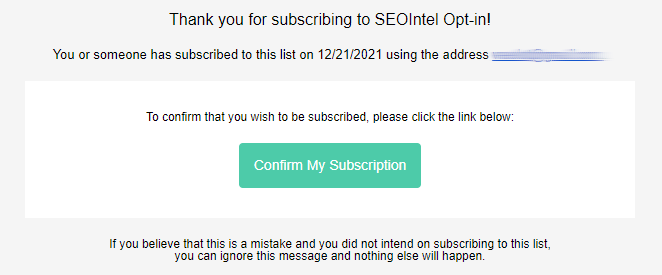
And that’s it!
PS: If you don’t see a confirmation email, please check your spam/junk or promotions folders. Sometimes the confirmation message ends up there by mistake.
Obtenez nos 7 études S.I.A. les plus controversées qui feront trembler la tête même les SEO les plus avancés d’incrédulité.
De plus, nous vous alerterons lorsque nous publierons de nouveaux tests au public.
Obtenga nuestros 7 estudios S.I.A. más controvertidos que harán que incluso el SEO más avanzado sacuda la cabeza con incredulidad.
Además, le avisaremos cuando publiquemos nuevas pruebas al público.
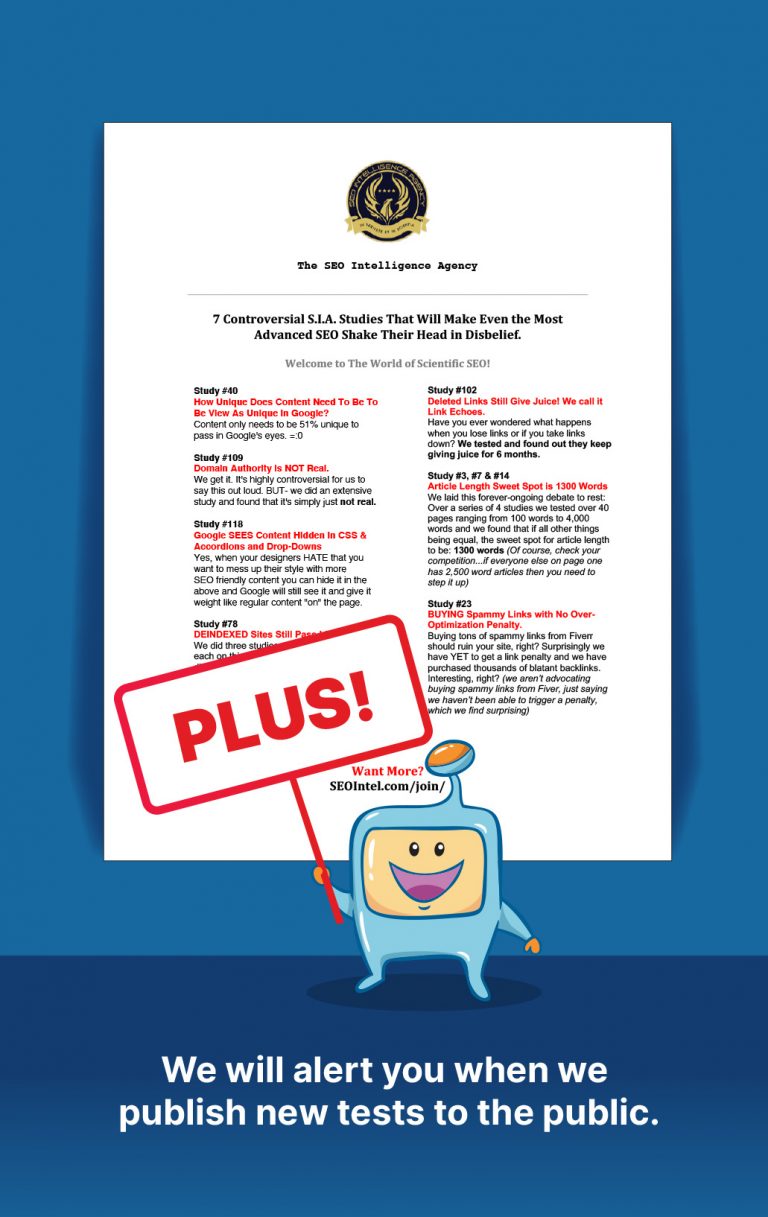
Get Our Most 7 Controversial S.I.A. Studies That Will Make Even the Most Advanced SEO Shake Their Head in Disbelief.
Plus we will alert you when we publish new tests to the public.