On November 23rd, 2021, Google’s Analytics Twitter channel had a tweet about Google Data Studio:
As you can see, the tweet claims that creating reports in Data Studio can be easy. (And I think it is, if you’re willing to follow a set of step-by-step instructions.)
It links to a Data Studio tutorial on creating reports.
From what I can tell, the tutorial has some easy-to-follow instructions that can guide anyone to create beautiful reports that are filled with data, and have an aesthetic appeal.
Let’s suppose you have to create a report for someone–say, a client, co-worker, or team leader–and this person doesn’t like “big numbers.”
No problem: framing something “hard to read” in an inviting, beautiful format can make the task of number-crunching more meaningful.
Plus, what’s to say that you couldn’t add your own embellishments?
I know I’m going a bit off track here, but maybe if you’re good at basic slide creating, you can put the report in PowerPoint or Google Sheets and enhance the report that way.
You can create arrows that point to certain milestones, with your commentary that interprets the significance of such milestones.
So, if you’d like to get more acquainted with Data Studio, specifically to create reports, Google’s Data Studio tutorial for report creation is a good place to start.
Source: Google Analytics Twitter channel
Before you can receive free updates, link building strategies or SEO tips you need to confirm your email right now.
(It’s easy)
Just go to your inbox, open the confirmation email from the SIA, and click the link.
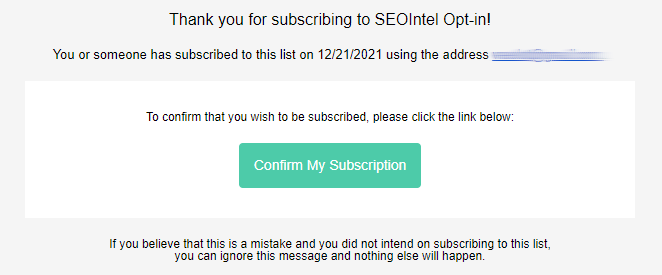
And that’s it!
PS: If you don’t see a confirmation email, please check your spam/junk or promotions folders. Sometimes the confirmation message ends up there by mistake.
Obtenez nos 7 études S.I.A. les plus controversées qui feront trembler la tête même les SEO les plus avancés d’incrédulité.
De plus, nous vous alerterons lorsque nous publierons de nouveaux tests au public.
Obtenga nuestros 7 estudios S.I.A. más controvertidos que harán que incluso el SEO más avanzado sacuda la cabeza con incredulidad.
Además, le avisaremos cuando publiquemos nuevas pruebas al público.
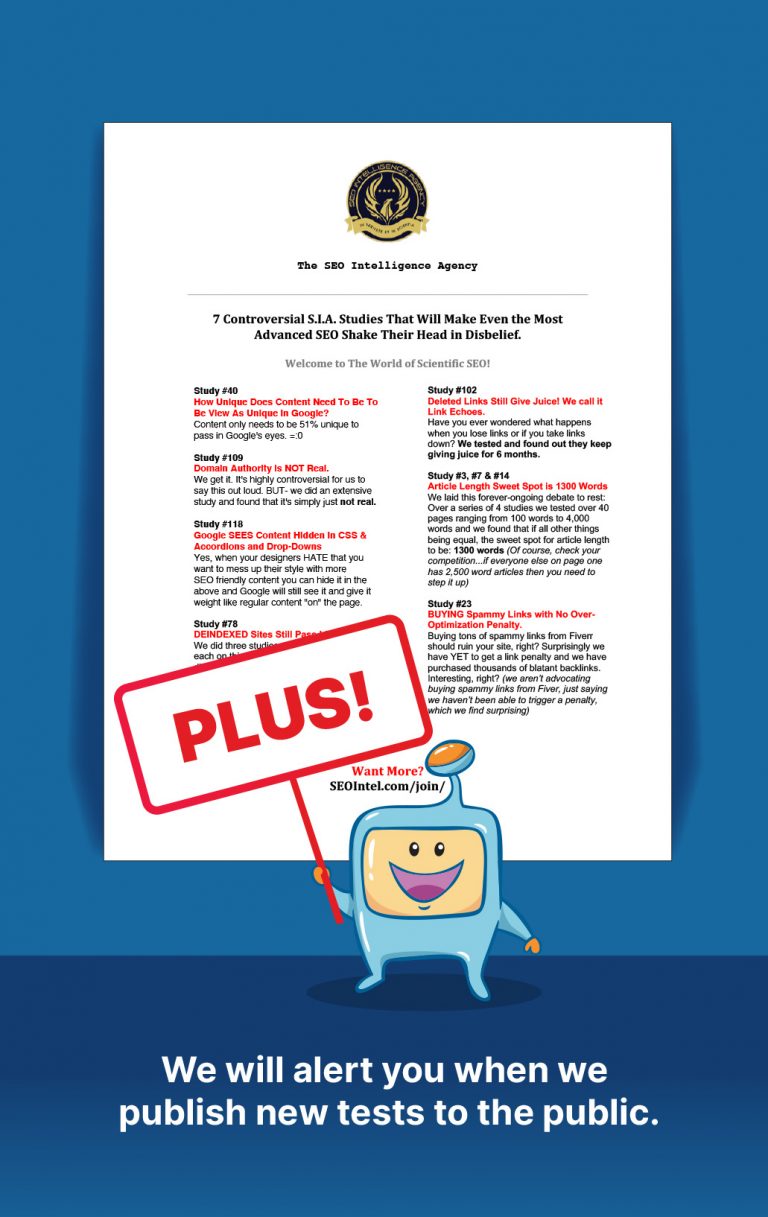
Get Our Most 7 Controversial S.I.A. Studies That Will Make Even the Most Advanced SEO Shake Their Head in Disbelief.
Plus we will alert you when we publish new tests to the public.