Recently, the Google Analytics Twitter channel had a tweet.
That tweet linked to Chloe Morgan’s How to Measure User Interactions in Google Analytics.
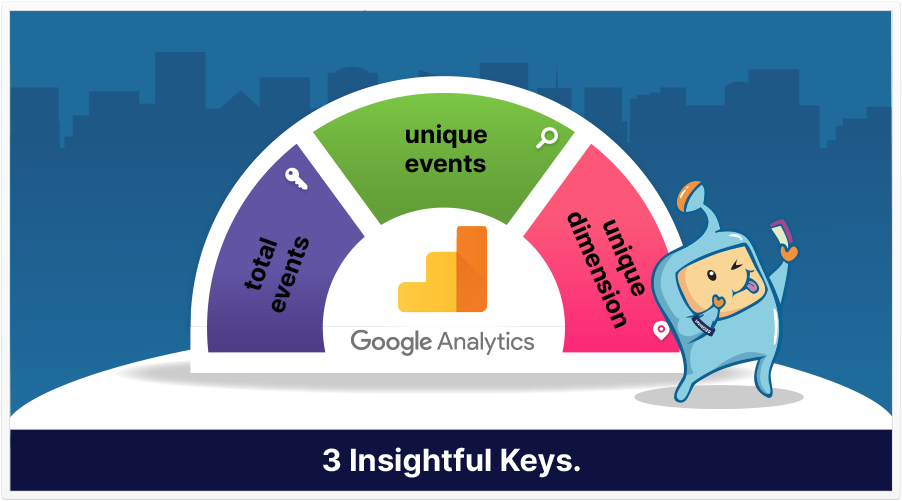
The article basically gives you a good definition of interaction, Unique Dimension Combinations, and Interaction Rate.
It does seem like working with these involves a learning curve, but as with anything worth having, it’s worth learning.
That article also features a 25-minute, 19-second video that helps you to not just get started with Google Analytics, but to start analyzing your product sales, and get insight into the interactions that may hint at these sales.
Know Your Prospect, Serve Them, and They May Become a Customer
That’s it, really. And you’ve probably done a lot of the preliminary steps that lead to this.
You’ve done your research.
You’ve looked at projected sales trends.
You’ve (probably) done your keyword research, SEO, and on-page optimization.
Now, you just need to refine things a little, gain some insight that you might not have otherwise gained, and voila! Just a few insightful, informed changes can result in a measurable increase in sales.
Your web visitors want something.
What is it?
Source: Google Analytics Twitter page
Before you can receive free updates, link building strategies or SEO tips you need to confirm your email right now.
(It’s easy)
Just go to your inbox, open the confirmation email from the SIA, and click the link.
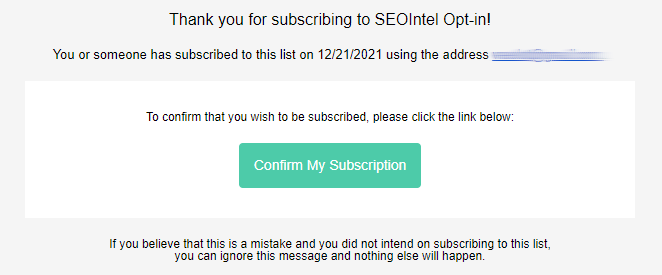
And that’s it!
PS: If you don’t see a confirmation email, please check your spam/junk or promotions folders. Sometimes the confirmation message ends up there by mistake.
Obtenez nos 7 études S.I.A. les plus controversées qui feront trembler la tête même les SEO les plus avancés d’incrédulité.
De plus, nous vous alerterons lorsque nous publierons de nouveaux tests au public.
Obtenga nuestros 7 estudios S.I.A. más controvertidos que harán que incluso el SEO más avanzado sacuda la cabeza con incredulidad.
Además, le avisaremos cuando publiquemos nuevas pruebas al público.
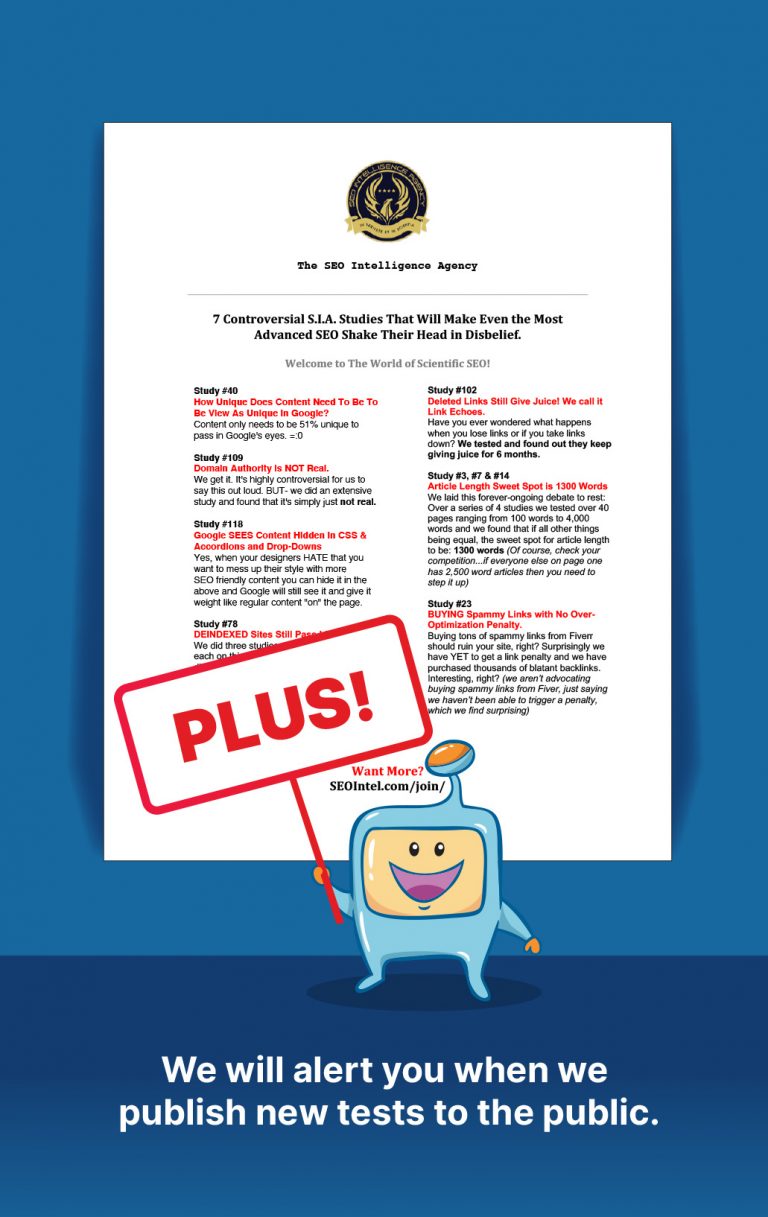
Get Our Most 7 Controversial S.I.A. Studies That Will Make Even the Most Advanced SEO Shake Their Head in Disbelief.
Plus we will alert you when we publish new tests to the public.