Google Analytics is a comprehensive website analytics software that has established itself as the industry standard.
With its powerful features and extensive reporting capabilities, it provides website owners and marketers with invaluable insights into their online performance.
Whether you have a personal blog, an e-commerce store, or a corporate website, Google Analytics offers a wealth of data to help you understand your audience, track website traffic, measure conversions, and optimize your online presence.
By harnessing the power of Google Analytics, you can make data-driven decisions and unlock the full potential of your website.
Here is what you will read in this article:
Google Analytics is a powerful web analytics tool that provides valuable insights into the performance of your website.
It allows you to track and analyze various metrics related to user behavior, traffic sources, conversions, and more.
With Google Analytics, you can gain a deep understanding of how users interact with your website, enabling you to make data-driven decisions to optimize your online presence and achieve your business goals.
Google Analytics offers a range of key features that empower you to gather meaningful data and derive actionable insights:

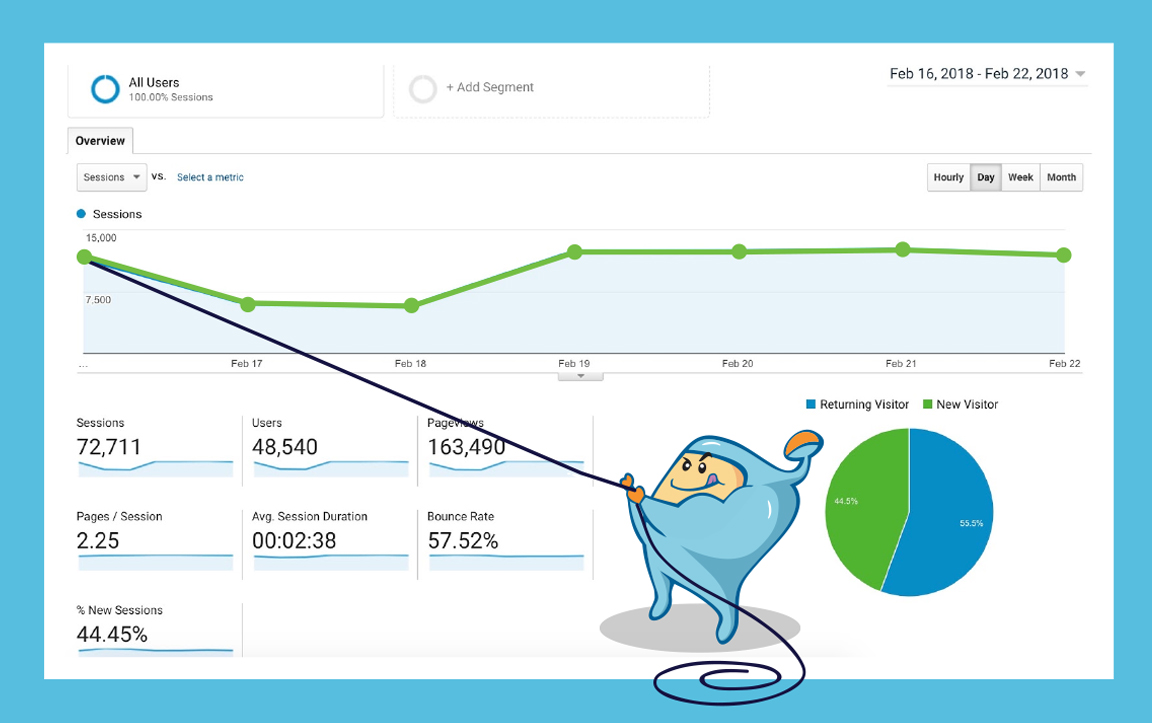
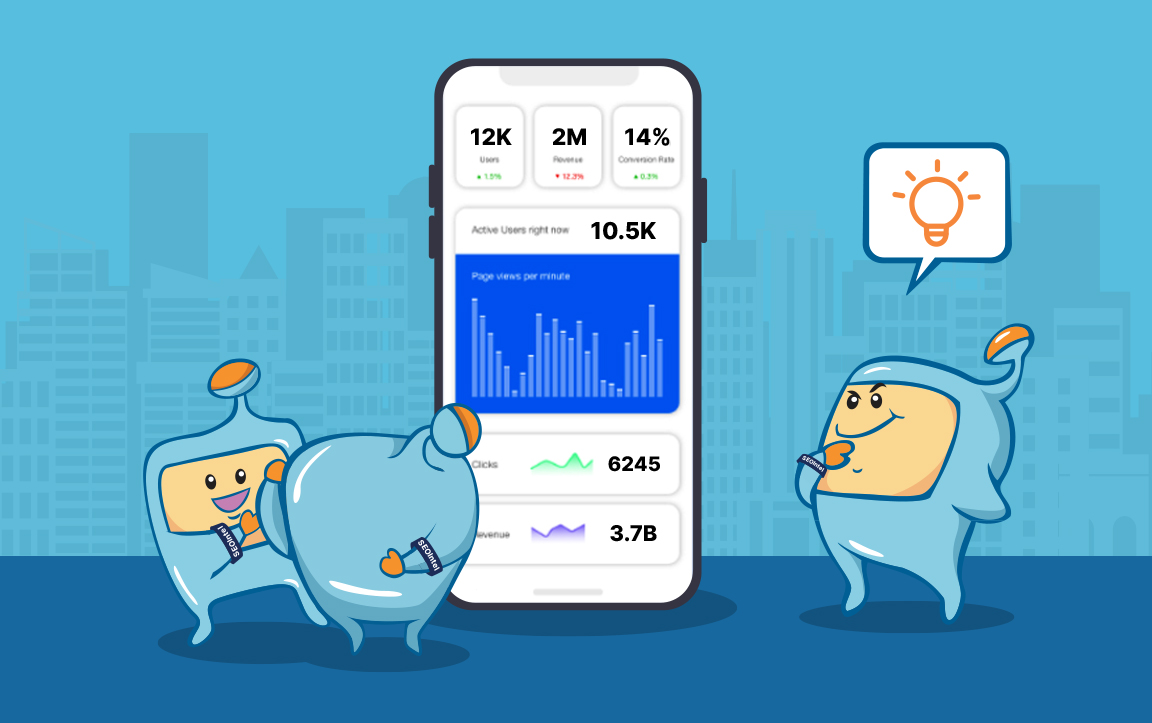
The "Google Analytics Home" is the central hub where users gain a quick overview of their website's performance upon logging into their Analytics account.
This intuitive and user-friendly interface provides a snapshot of essential metrics and key performance indicators (KPIs) that are crucial for evaluating the overall health of a website.
The Home page presents a comprehensive summary of important data, including the number of users and sessions, bounce rate, session duration, and traffic sources.
This centralized view allows users to assess the effectiveness of their website and quickly identify any areas that require attention or further analysis.
The Google Analytics Home serves as a convenient starting point for website owners and marketers to gather insights and make data-informed decisions to drive their online strategies forward.
This snapshot gives you a quick glimpse into your site's recent activity, allowing you to monitor its overall performance at a glance.
This metric represents the number of unique visitors to your website within a specified timeframe.
A session refers to the interactions a user has with your website within a given period.
It includes page views, events, transactions, and other activities.
The bounce rate indicates the percentage of users who leave your website after viewing only a single page.
A lower bounce rate suggests higher user engagement.
This metric measures the average time users spend on your website during a session.
A longer session duration often indicates a higher level of interest and engagement.
This section provides an overview of the various channels through which users are accessing your website, such as organic search, direct traffic, social media, and referrals.
The Real-Time feature allows you to monitor the live activity on your website, providing insights into the number of active users, their location, and the pages they are currently viewing.
The Audience section in Google Analytics focuses on providing detailed information about your website's visitors and their characteristics.
This valuable data can help you better understand your target audience and tailor your content to meet their needs.
This report gives you an overview of the number of sessions and users your website has attracted over a specific period.
It provides insights into the growth and engagement of your audience.
The Geo report reveals the geographic locations of your website visitors, allowing you to identify which regions generate the most traffic.
It also shows the languages spoken by your audience, providing valuable insights for localization efforts.
The Behavior report helps you differentiate between new and returning visitors.
Understanding this data can provide insights into how effectively you retain and engage your audience.
The Users Flow report visualizes the paths users take through your website, indicating where they enter, exit, and navigate.
This visualization enables you to optimize your website's structure and identify areas for improvement.
With the Mobile report, you can analyze the devices visitors use to access your website.
It allows you to identify the prevalence of mobile traffic and optimize your site's responsiveness accordingly.
The Acquisition section of Google Analytics focuses on tracking and analyzing the sources through which users find and reach your website.
This section is crucial for understanding how users discover your site and optimizing your marketing efforts.
The All Traffic report provides insights into the different channels through which users arrive at your website, such as organic search, referrals, direct traffic, and social media.
It helps you assess the effectiveness of your marketing strategies and determine which channels drive the most traffic.
The Referrals report specifically focuses on the websites that send traffic to your site.
It allows you to identify external sources that link to your content and drive visitors to your website.
The Search Console report integrates data from Google Search Console with Google Analytics, providing a more comprehensive view of your website's performance in organic search.
It offers valuable insights into search queries, click-through rates, and the average position of your website in search results.
This data enables you to optimize your organic search strategy and improve your website's visibility.
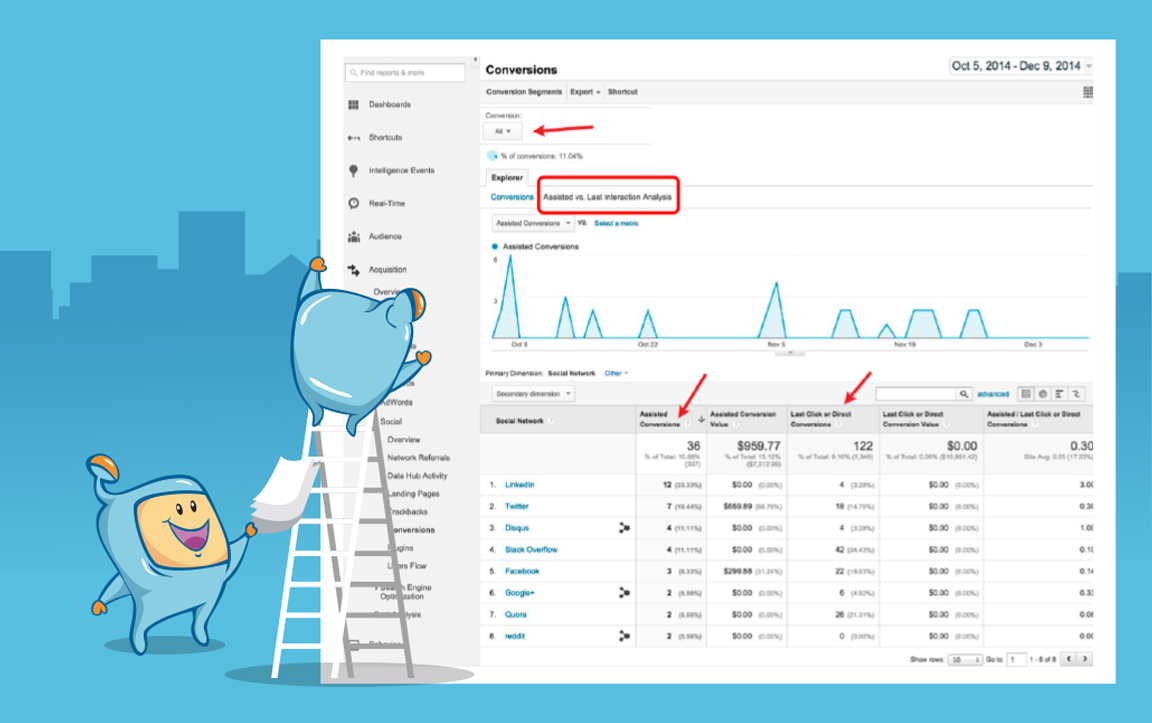
The Social report in Google Analytics allows you to analyze the impact of social media on your website's performance.
It provides data on the social networks that drive traffic to your site, the engagement levels of visitors from social media platforms, and the specific landing pages they land on.
This information helps you understand the effectiveness of your social media marketing efforts and refine your social media strategy.
The Behavior section of Google Analytics focuses on how users interact with your website and the content they engage with.
It provides insights into the performance of your web pages and the user experience.
The Site Content report allows you to evaluate the performance of individual pages on your website.
It provides data on pageviews, average time on page, bounce rate, and exit percentage.
By identifying the most popular and engaging content, you can optimize your website's structure, create more compelling content, and enhance the user experience.
The Site Speed report helps you assess the loading speed of your web pages. It provides valuable data on page load times, server response times, and page sizes.
With this information, you can identify any performance bottlenecks, optimize your website's speed, and provide a better user experience for your visitors.
The Events report tracks specific actions or events on your website, such as clicks on buttons, video plays, or downloads.
It enables you to measure user interactions beyond pageviews and gain insights into how users engage with your content.
By tracking events, you can understand the effectiveness of your calls-to-action and optimize your website for better user engagement and conversions.
The Conversions section in Google Analytics focuses on tracking and analyzing the actions that users take on your website, such as making a purchase, filling out a form, or subscribing to a newsletter.
The Reverse Goal Path report allows you to understand the steps users took before completing a specific conversion goal.
It provides insights into the most common paths users followed on your website and helps you identify any barriers or friction points in the conversion process.
The Ecommerce report is specifically designed for websites that sell products online.
It provides valuable data on revenue, transactions, conversion rates, and average order value.
With this information, you can assess the performance of your online store, identify product trends, and optimize your marketing and sales strategies.
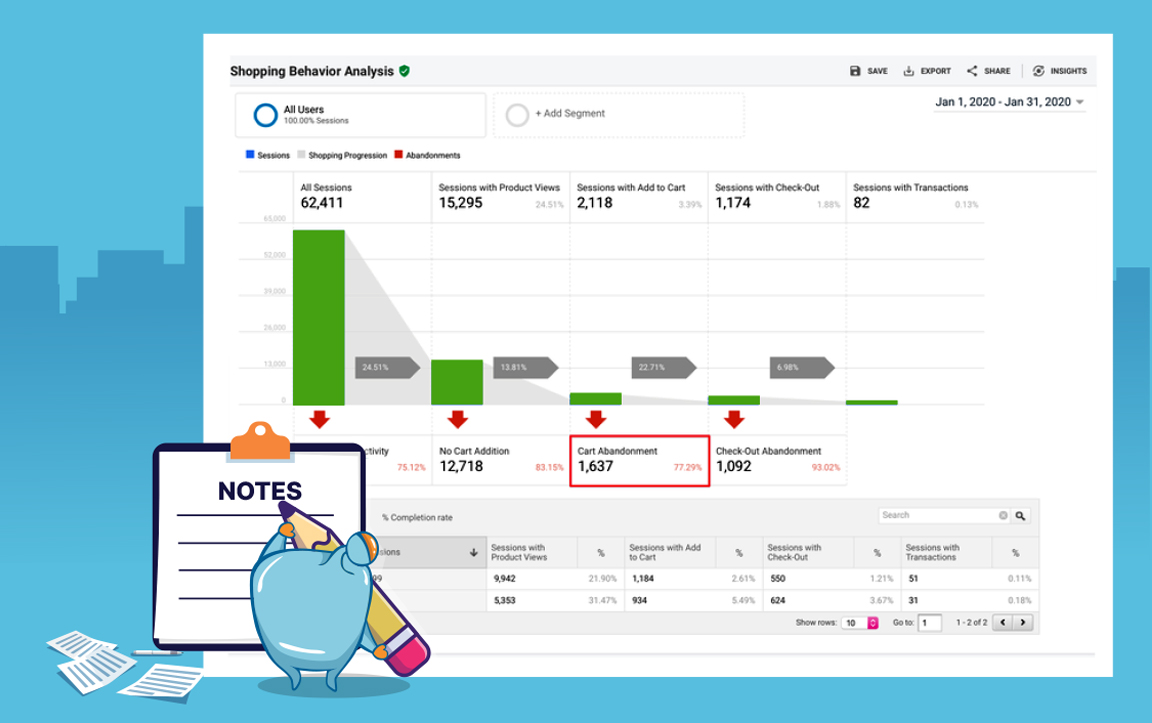
The Funnel Visualization report visualizes the steps users take in a predefined conversion funnel on your website.
It helps you understand the drop-off points in the conversion process and identify areas for improvement.
By analyzing this data, you can optimize your funnel, streamline the user journey, and increase conversion rates.
Google Analytics is a powerful tool that empowers website owners and marketers to gain deep insights into their website's performance.
From tracking visitor behavior and traffic sources to analyzing conversions and optimizing user experience, the features provided by Google Analytics enable data-driven decision-making and the continuous improvement of your online presence.
By leveraging the rich set of reports and metrics, you can understand your audience better, optimize your marketing strategies, and achieve your business goals more effectively.
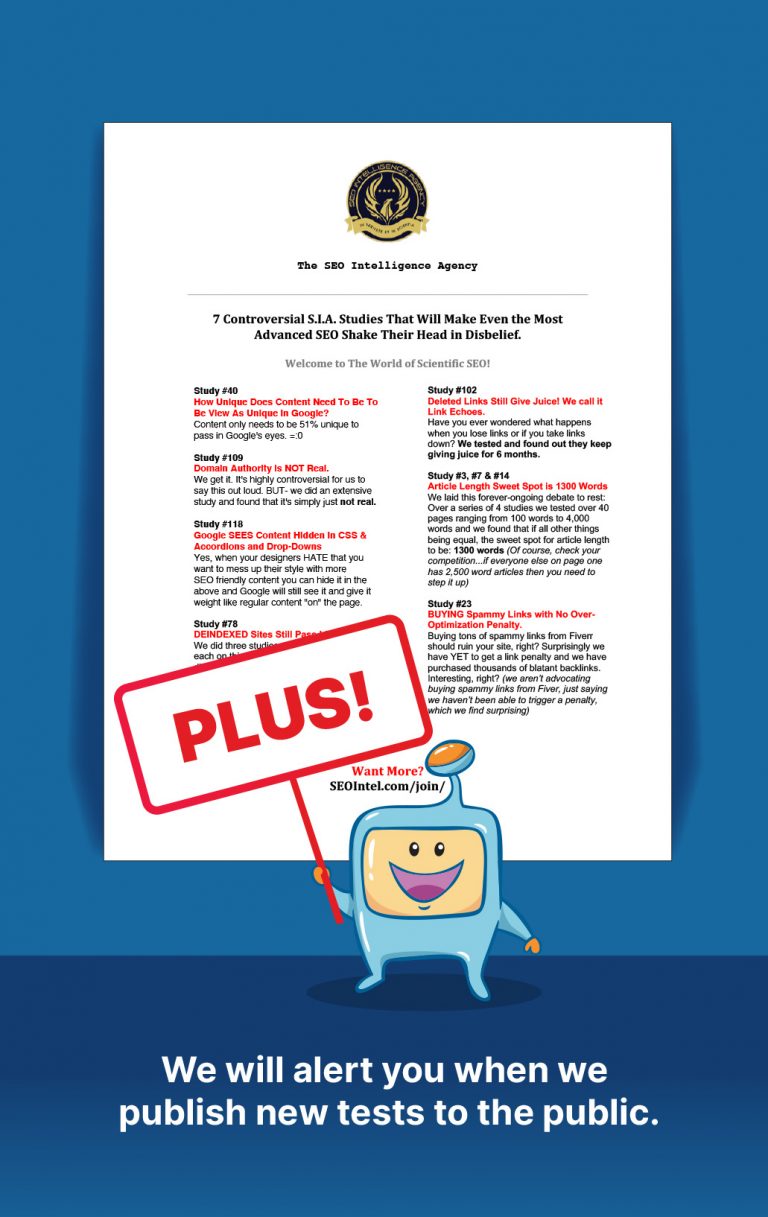
Get Our Most 7 Controversial S.I.A. Studies That Will Make Even the Most Advanced SEO Shake Their Head in Disbelief.
Plus we will alert you when we publish new tests to the public.
Obtenga nuestros 7 estudios S.I.A. más controvertidos que harán que incluso el SEO más avanzado sacuda la cabeza con incredulidad.
Además, le avisaremos cuando publiquemos nuevas pruebas al público.
Obtenez nos 7 études S.I.A. les plus controversées qui feront trembler la tête même les SEO les plus avancés d’incrédulité.
De plus, nous vous alerterons lorsque nous publierons de nouveaux tests au public.
Before you can receive free updates, link building strategies or SEO tips you need to confirm your email right now.
(It’s easy)
Just go to your inbox, open the confirmation email from the SIA, and click the link.
And that’s it!
PS: If you don’t see a confirmation email, please check your spam/junk or promotions folders. Sometimes the confirmation message ends up there by mistake.