The thing that’s significant about data processing and data freshness in Google Analytics is that, generally, the larger the data processing time, the more comprehensive the report.
What do I mean by that?
I’ll get to that shortly.
Yesterday, I came across this tweet (which was a retweet from the Google Analytics Twitter channel),
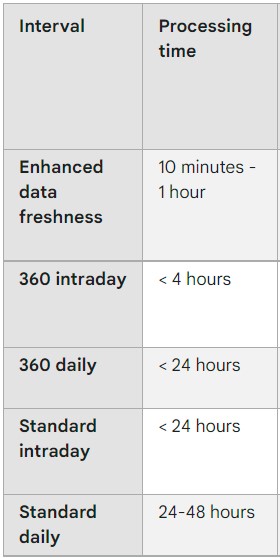
That tweet didn’t link anywhere off of Twitter, but upon doing some research, I came across this Analytics Help page: Enhanced Data Freshness.
Here’s a partial screenshot I took:
But, in a quest to know more, I also watched this video, which, as of 2021, is about 4 years old, so the data might be a little outdated, but the basics are the same:
And then I got it.
Remember how I said that “the larger the data processing time, the more comprehensive the report?”
So, for the smaller time frames (that is, for the Enhanced data freshness, which is a 10-minute to 1-hour time frame) you can find out what’s happening right now (or almost right now).
It’s a good time frame to use when you want to test out quick changes (such as the position of a buy button), and you have the traffic to do so at the moment.
Now, in the heading of this section, I say, “larger time frames, better conclusions.” I say that because, if you’ve ever worked with medium- to long-term charts, you know that the smaller the time frame, the more ‘noise’ there is, but when you look at larger and larger time frames, the more you can see a pattern.
That holds in trading, and the same is the case here. If you want to find a trend, it’s better to look at the larger time frames. So, in terms of data freshness, that would be standard daily reports.
But, don’t just look at each day individually; instead, look back over days, weeks, and months to see if you can sense a pattern or a trend.
Maybe there’s something seasonal?
Before you can receive free updates, link building strategies or SEO tips you need to confirm your email right now.
(It’s easy)
Just go to your inbox, open the confirmation email from the SIA, and click the link.
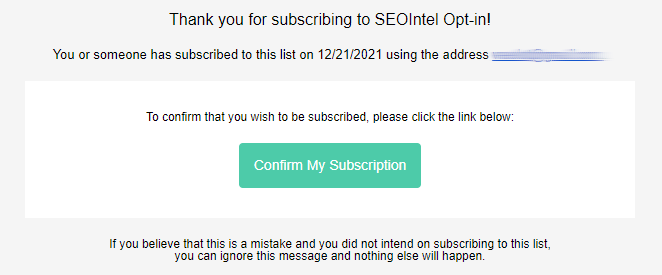
And that’s it!
PS: If you don’t see a confirmation email, please check your spam/junk or promotions folders. Sometimes the confirmation message ends up there by mistake.
Obtenez nos 7 études S.I.A. les plus controversées qui feront trembler la tête même les SEO les plus avancés d’incrédulité.
De plus, nous vous alerterons lorsque nous publierons de nouveaux tests au public.
Obtenga nuestros 7 estudios S.I.A. más controvertidos que harán que incluso el SEO más avanzado sacuda la cabeza con incredulidad.
Además, le avisaremos cuando publiquemos nuevas pruebas al público.
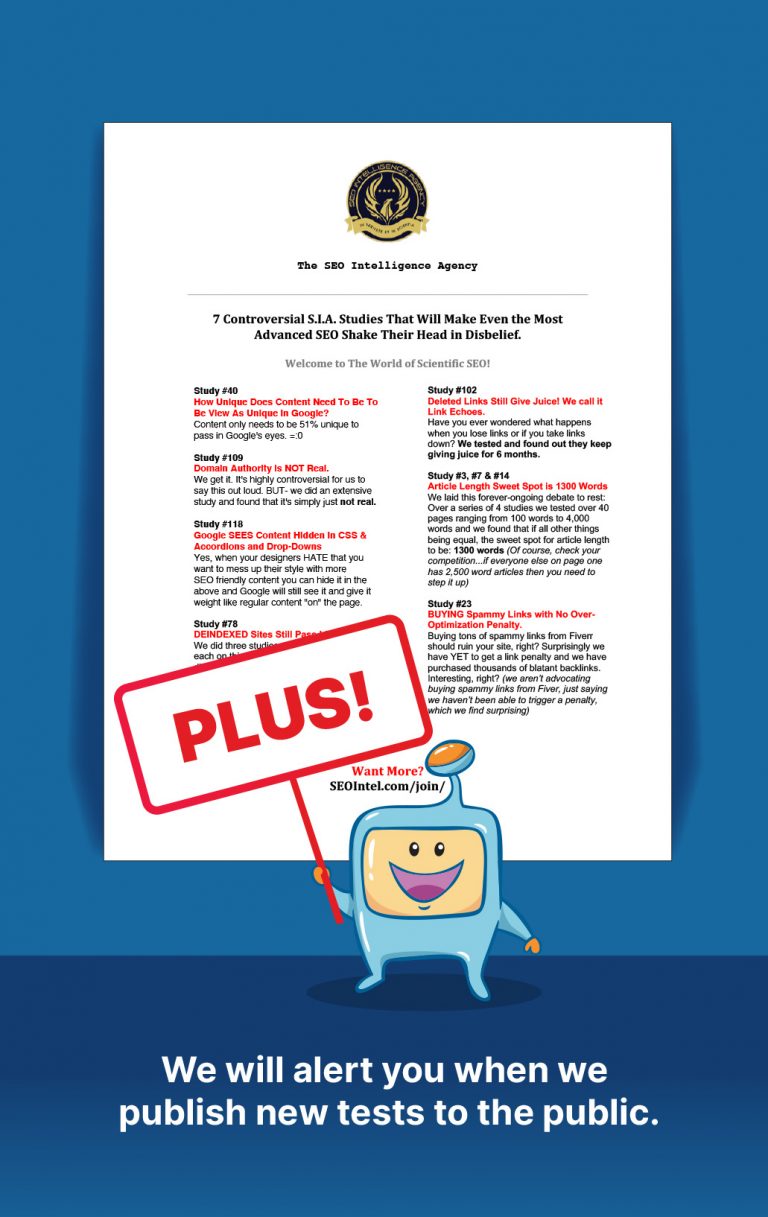
Get Our Most 7 Controversial S.I.A. Studies That Will Make Even the Most Advanced SEO Shake Their Head in Disbelief.
Plus we will alert you when we publish new tests to the public.