Last week, we reported that Screaming Frog announced an SEO spider update (to version 16.0). This seems to have been a significant update, and even Google retweeted about it.
Yesterday, on the Google Analytics Twitter channel, there was a tweet about a Screaming Frog tutorial.
The tweet links to Screaming Frog’s tutorial, titled, How to Automate Crawl Reports In Data Studio.
This is significant, and if you’re familiar with Google Data Studio, then you know how much of a time savings this can be (especially over time).
In case you’re not aware of Google Data Studio, I’d like to give a brief introduction.
Google Data Studio is a platform where you can combine data from various sources. The term that applies to this is blended data, and it allows you to see data in a new, more complete way.
I wrote an article on this, titled, Google Data Studio: Google Tweets New Article on Blended Data Sources. In that article, I used the example of combining the data from Google Analytics and Google Search Console.
Well, with Screaming Frog, you now have another data source.
The tutorial shows you how to set up Screaming Frog so that, at intervals you set, it crawls your site, appends data in Google Sheets. That appended data can then be made available in Google Data Studio.
The Big Benefit of More Data…If You Have the Wisdom to See It for What It Is
Having more data, if you have the wisdom to interpret that data, can be a great asset. With data comes (hopefully) information, and with wisdom and a creative way of looking at things, that information can become insights.
Those insights can cause you to say, “Hey…now that we’ve put that and that together, something emerges.” That something may not be new, but just something that was always there, but that you hadn’t seen until now.
It can be fun to have various members of your team look at your blended data, because perhaps different people can see things from different angles, and bring something new to the table.
Source: Google Analytics Twitter channel
Before you can receive free updates, link building strategies or SEO tips you need to confirm your email right now.
(It’s easy)
Just go to your inbox, open the confirmation email from the SIA, and click the link.
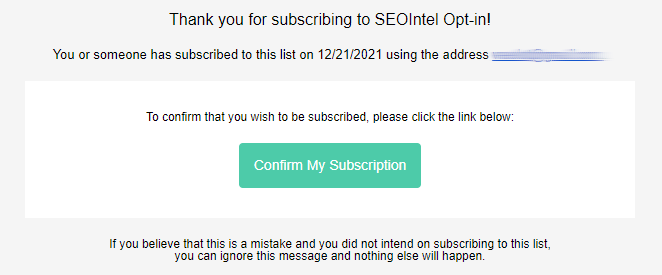
And that’s it!
PS: If you don’t see a confirmation email, please check your spam/junk or promotions folders. Sometimes the confirmation message ends up there by mistake.
Obtenez nos 7 études S.I.A. les plus controversées qui feront trembler la tête même les SEO les plus avancés d’incrédulité.
De plus, nous vous alerterons lorsque nous publierons de nouveaux tests au public.
Obtenga nuestros 7 estudios S.I.A. más controvertidos que harán que incluso el SEO más avanzado sacuda la cabeza con incredulidad.
Además, le avisaremos cuando publiquemos nuevas pruebas al público.
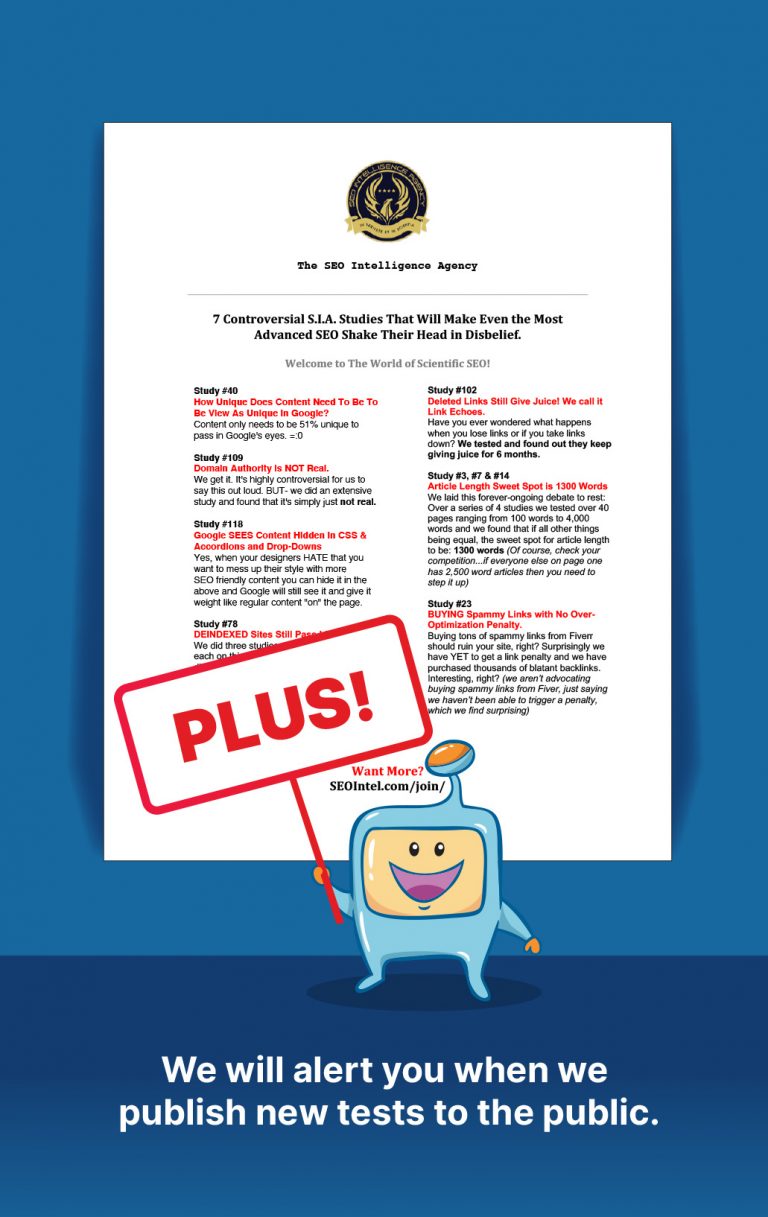
Get Our Most 7 Controversial S.I.A. Studies That Will Make Even the Most Advanced SEO Shake Their Head in Disbelief.
Plus we will alert you when we publish new tests to the public.